The CCC crash course for CFOs: Nail the cash conversion cycle formula (DIO, DSO, DPO) to improve cash flow, liquidity, and working capital performance.
Key takeaways
- The cash conversion cycle (CCC) measures how many days it takes a business to turn operational investments into cash, calculated as Days Inventory Outstanding (DIO) + Days Sales Outstanding (DSO) - Days Payable Outstanding (DPO).
- According to J.P. Morgan's Working Capital Index 2024, the average CCC for the largest U.S. nonfinancial companies was 37 days, though benchmarks vary significantly by industry and business model.
- A negative CCC is possible and desirable: it means customers pay before suppliers are owed, effectively letting customers finance operations.
- J.P. Morgan estimates $707 billion in working capital could be released across S&P 1500 companies by optimizing DIO, DSO, and DPO, with inventory representing the largest single opportunity.
- For Canadian SMBs, 29% report insufficient cash flow as a top financial challenge (Float Financial, 2024), making CCC management a practical priority, not just a corporate finance exercise.
- AP and AR automation directly improve CCC by accelerating collections, reducing invoice errors, and enabling smarter payables timing, all of which Plooto is built to support.
What is the cash conversion cycle?
The cash conversion cycle (CCC) is a financial metric that measures how many days it takes a company to convert its operational investments into cash. It tracks the complete journey of a dollar from the moment a business spends on inventory or inputs, through the sale, to the moment the customer's payment clears the bank.
Also called the cash-to-cash cycle, net operating cycle, or operating cash cycle, CCC is expressed in days. A lower number means cash moves through the business quickly. A higher number means cash is tied up longer in inventory, receivables, or both.
Investopedia and the Corporate Finance Institute both treat CCC as one of the most practical indicators of working capital efficiency because it connects three separate operational realities into one actionable number.
Why CFOs track CCC as a core KPI
The CCC reveals something that revenue figures and profit margins cannot: how efficiently the business converts its resources into cash at a given point in time. A company can be profitable on paper while still running short on cash if its cycle is too long.
For Canadian businesses navigating high interest rates and inconsistent revenue, this gap between profit and liquidity is especially acute. According to Float Financial's State of SMB Finance in Canada (2024), 29% of Canadian SMBs report insufficient cash flow as a top financial challenge, and 40% say their difficulties escalated over the past year. Shortening the CCC is one of the few levers that improves liquidity without requiring external capital.
For U.S. companies, J.P. Morgan's 2024 Working Capital Index estimates $707 billion in working capital could be released across the S&P 1500 by closing the gap to best-in-class DIO, DSO, and DPO performance. Days inventory outstanding alone represents $353 billion of that opportunity.
CCC vs cash flow: what is the difference?
Cash flow measures actual money movement over a period. CCC measures the operational efficiency that generates that cash. A business can run positive cash flow while carrying a long, inefficient CCC, meaning the cash position could be materially stronger with tighter cycle management. CCC is a forward-looking efficiency indicator; cash flow is its realized outcome.
The cash conversion cycle formula: DIO + DSO - DPO
The CCC formula is:
CCC = DIO + DSO - DPO
Each component captures a different phase of the operational cycle:
|
Component |
What it measures |
Data source |
|
DIO (days inventory outstanding) |
How long inventory sits before being sold |
Balance sheet + income statement |
|
DSO (days sales outstanding) |
How long it takes to collect payment after a sale |
Balance sheet + income statement |
|
DPO (days payable outstanding) |
How long the company takes to pay its suppliers |
Balance sheet + income statement |
Breaking down each component
Days Inventory Outstanding (DIO) measures the average number of days inventory is held before it converts to a sale. It is calculated as:

A lower DIO is generally better, but context matters. Grocery businesses carry low DIO because products are perishable and turn quickly. Manufacturers and specialty retailers carry higher DIO because production and sales cycles are longer.
Days Sales Outstanding (DSO) measures how long it takes to collect payment after an invoice is issued. It is calculated as:

DSO is the most directly controllable component for service-based businesses and B2B companies. An optimized accounts receivable process shortens DSO by reducing invoicing delays, improving follow-up cadence, and making it easier for customers to pay.
Days Payable Outstanding (DPO) measures how long the business takes to pay its own suppliers. It is calculated as:
DPO = (Average Accounts Payable / Cost of Goods Sold) x 365
Unlike DIO and DSO, a higher DPO improves CCC. Extending payment terms strategically keeps cash in the business longer. The trade-off is supplier relationships: pushing DPO beyond what suppliers consider reasonable risks service disruptions and strained terms.
Why the formula subtracts DPO
DPO is subtracted because supplier credit offsets the cash requirement. If a company buys inventory and has 45 days to pay for it, those 45 days are essentially funded by the supplier, not the company's own capital. The CCC captures only the period during which the business itself is financing operations.
How to calculate CCC: a step-by-step example
The inputs all come from the balance sheet and income statement. Here is a worked example for a mid-sized manufacturing company:
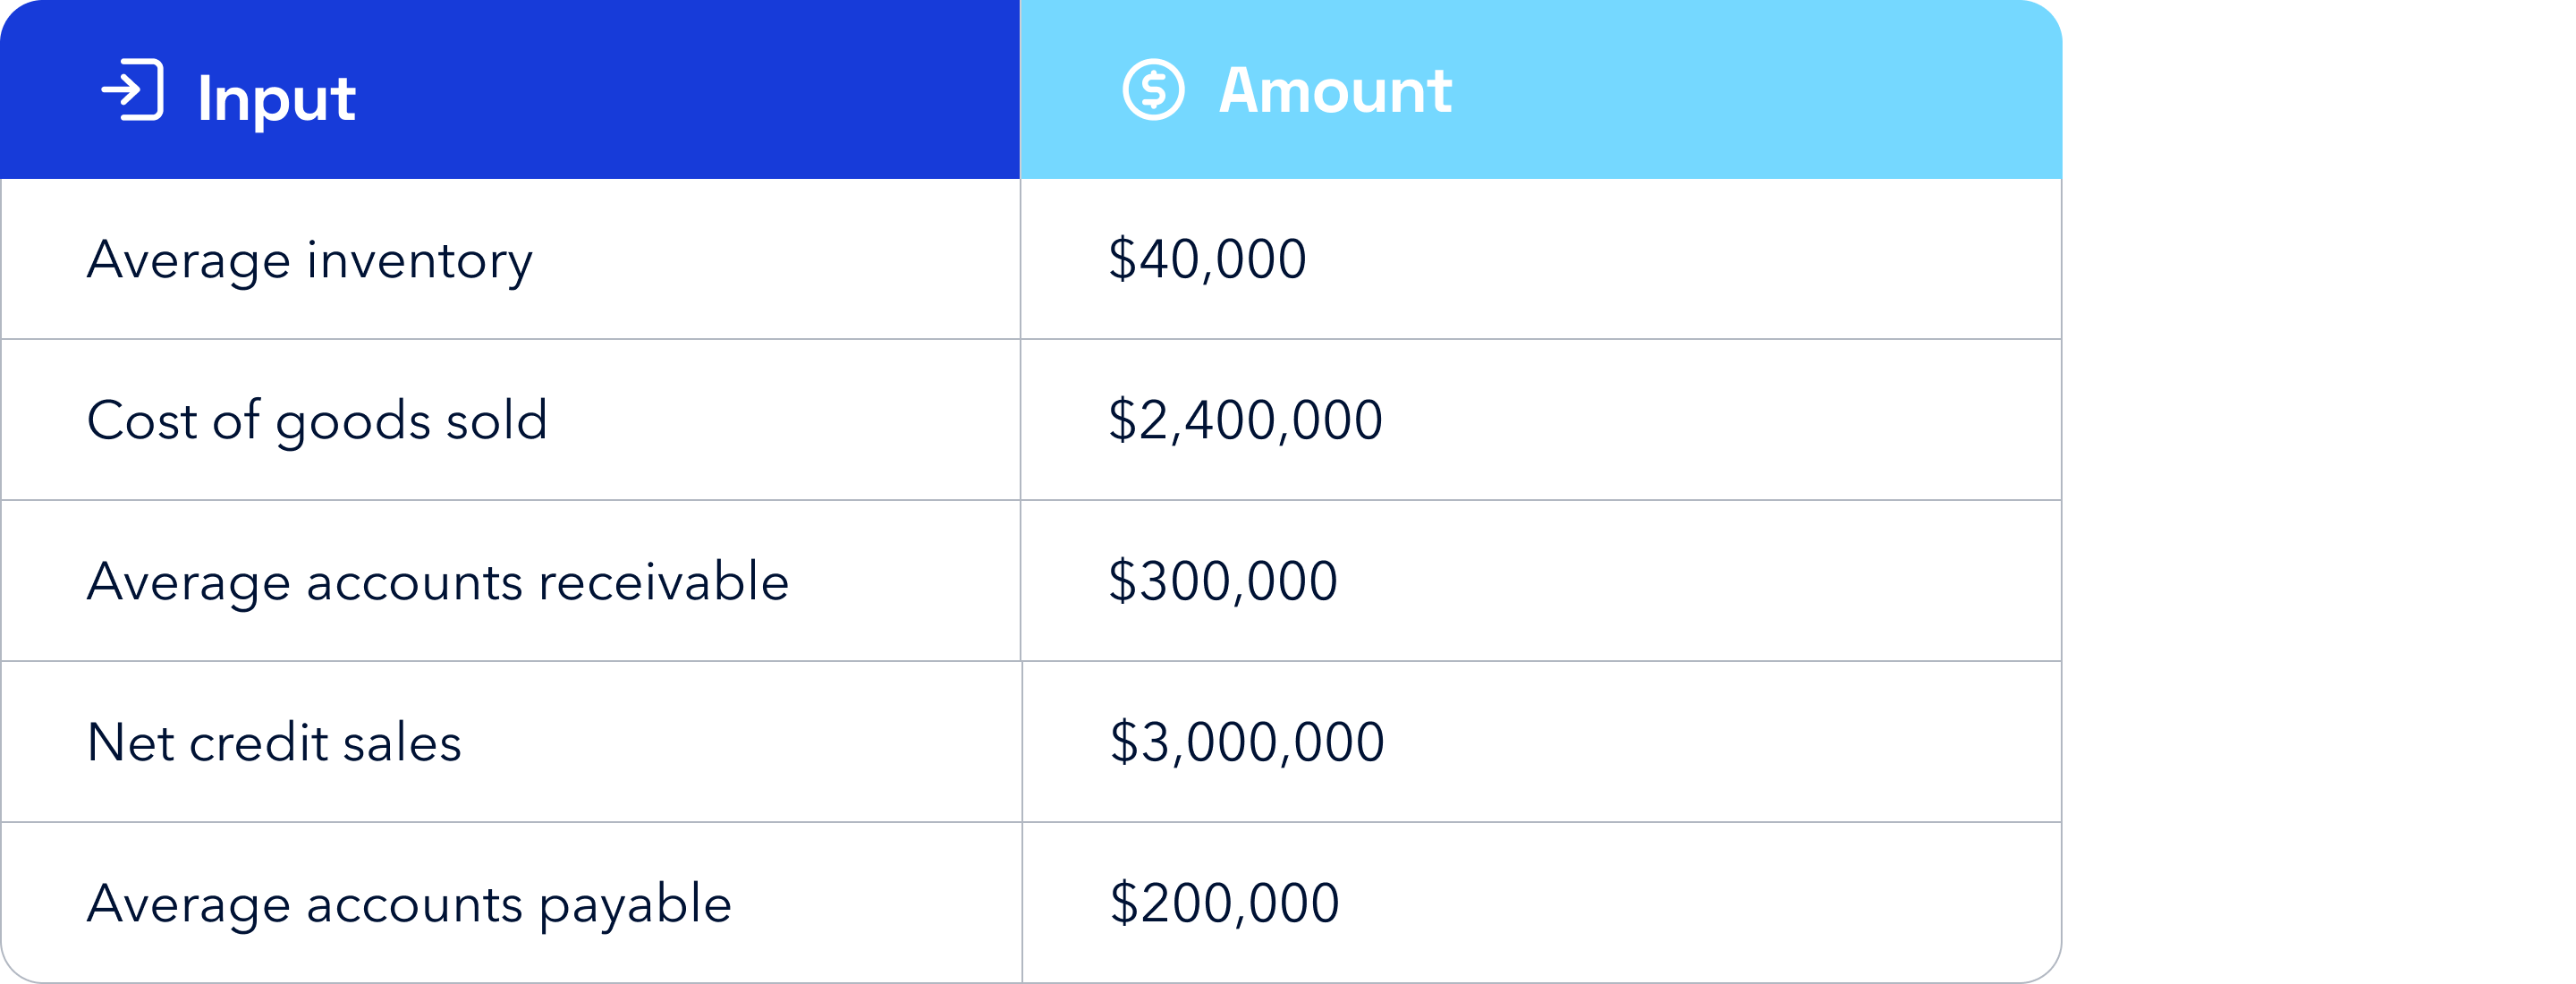
Step 1: DIO = ($400,000 / $2,400,000) x 365 = 60.8 days
Step 2: DSO = ($300,000 / $3,000,000) x 365 = 36.5 days
Step 3: DPO = ($200,000 / $2,400,000) x 365 = 30.4 days
Step 4: CCC = 60.8 + 36.5 - 30.4 = 66.9 days
This company is waiting roughly 67 days from the time it invests in inventory to the time customer cash arrives. Whether that is good or poor depends entirely on the industry.
Common ccc calculation errors to avoid
- Using total revenue instead of net credit sales for DSO: this inflates DSO if a significant portion of sales are cash transactions
- Using period-end balances instead of averages: averaging beginning and ending balances for inventory, AR, and AP produces more accurate results than using a single snapshot
- Inconsistent time periods: use the same period across all three components; mixing monthly AR data with annual COGS produces a distorted result
Negative, positive, and high cash conversion cycles
What is a negative cash conversion cycle?
A negative CCC occurs when DPO exceeds the sum of DIO and DSO. In plain terms, the business collects from customers before it owes suppliers. Its customers are effectively financing its operations.
Amazon is the most cited example. By collecting at the point of purchase while negotiating 60-plus-day terms with suppliers, Amazon historically operated at a CCC of approximately -20 to -30 days, funding enormous growth without proportional external capital.
A negative CCC is not achievable or appropriate for every business. It requires significant supplier leverage and volume. Smaller businesses that push DPO aggressively without that leverage typically damage supplier relationships and risk inventory shortages.
What is a good CCC?
The right answer is: lower than your industry peers, and improving over time. A CCC of 30 days might be excellent for a manufacturer and unremarkable for a grocery retailer. Context is everything.
As a general orientation, the Corporate Finance Institute frames interpretation this way:
- Below 30 days: generally strong, indicating fast cash conversion
- 30 to 60 days: average; improvement is likely possible
- Above 60 days: warrants investigation, especially in service-based businesses where inventory is not a factor
J.P. Morgan's Working Capital Index 2024 reported that the average CCC across the 1,000 largest U.S. nonfinancial companies improved to 37 days in 2024 after rising by approximately 2.4 days in 2023. These numbers reflect large-cap company performance; SMB benchmarks vary considerably.
How AP and AR automation improve CCC
Manual processes inflate CCC by introducing delays at every stage. Invoices go out late, follow-up is inconsistent, payment processing is slow, and reconciliation takes days instead of hours. Each delay extends the cycle.
Automation addresses all of these simultaneously. Plooto's accounts payable automation software streamlines supplier payments, approval workflows, and reconciliation, giving finance teams control over DPO without the administrative overhead of manual processing. On the AR side, automated invoicing and collections workflows compress DSO by removing the human bottlenecks between invoice delivery and receiving the funds.
For accountants and bookkeepers managing multiple client relationships, highly trusted accounting solutions apply consistent AR and AP processes across all clients simultaneously, scaling CCC optimization without scaling headcount.
When a high CCC signals risk
A high CCC on its own is not automatically a problem. A luxury goods manufacturer with a 120-day CCC might be performing exactly as the industry expects. The warning signal is a rising CCC trend alongside constrained working capital: that combination suggests the business is funding a longer operational cycle with less buffer to absorb disruption.
Operating cycle vs cash conversion cycle
The operating cycle (DIO + DSO) measures total time from inventory purchase to cash collection. CCC subtracts DPO to show only the days the business has to fund from its own capital. Most CFOs default to CCC for working capital planning because it captures the actual funding requirement, not just gross operational timing. Plooto is built to compress both sides of that equation, pulling DSO down and giving finance teams structured control over DPO.
CCC benchmarks by industry
Industry is the primary determinant of CCC. Business model, payment terms, inventory type, and customer mix all shape the cycle. Comparing a retailer to a manufacturer produces no useful insight. Within-sector benchmarking is the only meaningful comparison.
|
Industry |
Typical CCC range |
Key driver |
|
Grocery / FMCG |
10 to 20 days |
Fast inventory turnover, point-of-sale cash collection |
|
Specialty retail |
60 to 90 days |
Longer sales cycles, seasonal inventory patterns |
|
SaaS / software |
Low or negative |
No physical inventory; often subscription-based billing |
|
Manufacturing |
50 to 100+ days |
Extended production and payment cycles |
|
Healthcare |
Variable |
Insurance reimbursement delays inflate DSO significantly |
|
Construction |
100+ days |
Project-based billing and long client payment cycles |
For Canadian businesses in healthcare specifically, the combination of insurance reimbursement timelines and administrative overhead creates structural DSO pressure that is difficult to address without dedicated healthcare-specific financial workflows.
The most important benchmark is your own trend line. A manufacturing company reducing CCC from 120 to 100 days has made meaningful progress, even if it has not reached the efficiency profile of a software business.
CCC & working capital strategy
How CCC connects to working capital
Working capital is current assets minus current liabilities. CCC explains the speed at which those assets cycle. A shorter CCC means assets convert to cash faster, reducing the amount of working capital the business needs to hold in reserve. A longer CCC means more capital is tied up in the operational cycle at any given time, requiring either larger reserves or external financing to cover the gap.
McKinsey's working capital research shows that companies systematically reducing their CCC generate higher returns on invested capital: the same output requires less capital to sustain.
CCC in cash flow forecasting
A stable, predictable CCC makes cash flow forecasting considerably more reliable. If a business knows it consistently converts operational inputs to cash in 45 days, finance teams can model monthly inflows and outflows with confidence. When the CCC is volatile or lengthening without explanation, forecast accuracy degrades and the business is forced to hold larger cash buffers as insurance.
Cash management tools give finance teams visibility into payment timing across both payables and receivables, which is the foundation for accurate CCC tracking. For startups and growing companies where cash timing is especially consequential, financial operations tools provide the controls needed to manage the cycle without enterprise-level complexity.
How to improve & shorten the cash conversion cycle
Three levers drive CCC improvement: reduce DIO, reduce DSO, or extend DPO. In practice, the highest ROI usually comes from DSO reduction because it is the most directly actionable and does not carry the supplier relationship risk of DPO extension.
Reduce DIO: Sell inventory faster
- Forecast demand accurately to avoid overstocking slow-moving inventory
- Shift toward just-in-time procurement where supply chains allow
- Identify stale SKUs and liquidate to free tied-up capital
For businesses with no physical inventory (professional services, SaaS), DIO is effectively zero and the entire CCC improvement effort falls on DSO and DPO.
Reduce DSO: Collect receivables faster
The tactics that consistently reduce DSO are the same ones that improve CEI (collection effectiveness index):
- Invoice immediately upon delivery, never batch-bill at month-end
- Automate reminders at defined intervals before and after due dates
- Offer multiple payment methods: ACH, EFT, and card
- Resolve disputes quickly to prevent invoices from aging past terms
- Tighten credit policies for new customers; review existing limits annually
The benefits of AR automation show up directly in DSO. Automated dunning and electronic invoicing remove the manual delays that let receivables age without follow-up.
Extend DPO: Pay suppliers strategically
The goal is to pay suppliers as late as your agreed terms allow without incurring penalties or damaging relationships. A few practical approaches:
- Negotiate longer terms with suppliers at renewal rather than informally extending payment
- Use dynamic discounting: offer early payment in exchange for a discount when cash is flush, let terms run when it is not
- For Canadian businesses, Plooto's online CRA payments feature helps manage tax remittances on schedule without disrupting supplier payment timing
Automation and technology for CCC optimization
Instant payments and CCC compression
Payment speed is a direct CCC input. The faster a customer's payment clears, the shorter the DSO for that transaction. Plooto's instant payments feature reduces the lag between payment initiation and cash receipt. The broader Plooto product suite is built on the premise that the invoice-to-cash and purchase-to-pay cycles should run with minimal friction, because every day of friction is a day of unnecessary cycle extension.
Key capabilities to look for in AP/AR automation
When evaluating finance workflow automation tools, the features that directly move the CCC needle are:
- Automated invoice delivery and payment reminders (reduces DSO)
- Approval workflows that prevent payment delays (stabilizes DPO)
- Real-time reconciliation with accounting software (reduces errors that delay collection)
- Multiple payment method support (reduces customer friction, shortens DSO)
- Reporting on payment timing trends across receivables and payables
Three CCC pitfalls to avoid
Over-optimizing one component is the most common mistake. Pushing DPO aggressively while ignoring DSO may improve the CCC number on paper while damaging supplier relationships. True optimization balances all three levers against operational realities.
Treating CCC as a one-time calculation misses its value. CCC is a trend metric; a single result is a snapshot. Three consecutive quarters of upward movement without a clear operational explanation warrants a process review across AR, AP, and inventory management.
Benchmarking across industries produces misleading conclusions without proper peer context. A 10-day CCC for a professional services firm and a 90-day CCC for a specialty manufacturer can both represent strong performance. The only meaningful comparison is within your own sector.
From formula to action: building a smarter cash conversion cycle
The cash conversion cycle is a live indicator of operational efficiency, and it responds directly to improvements in invoicing, collections, payables management, and inventory discipline. It is not a metric to calculate once and file away.
For businesses in Canada and the U.S., the fastest path to a shorter CCC runs through two levers: a faster AR cycle and a more disciplined AP process. When invoices go out on time, reminders fire automatically, customers have frictionless ways to pay, and supplier payments run to terms rather than being managed manually, the cycle compresses.
Plooto connects both sides in a single platform, giving finance teams the tools to manage invoice-to-cash and purchase-to-pay cycles precisely, without the manual overhead that inflates every CCC component.
Ready to shorten your cash conversion cycle? Start a free trial to see how Plooto helps businesses improve working capital performance.
Frequently asked questions
What does CCC stand for?
CCC stands for cash conversion cycle, the number of days it takes a business to convert operational investments into cash.
What is the cash conversion cycle formula?
CCC = DIO + DSO - DPO. DIO is days inventory outstanding, DSO is days sales outstanding, and DPO is days payable outstanding.
What is a good cash conversion cycle?
It depends on the industry. A CCC below 30 days is generally strong; 30 to 60 days is average; above 60 days warrants review. The most meaningful benchmark is how your CCC compares to direct competitors and how it trends over time.
What is a negative cash conversion cycle?
A negative CCC means the business collects from customers before it pays suppliers. This is typically achieved through strong supplier negotiating power, high transaction volume, or subscription-based billing. It is a favorable position but not always achievable or appropriate for smaller businesses.
How does CCC differ from operating cycle?
The operating cycle is DIO + DSO. CCC subtracts DPO to isolate the days the business funds from its own capital. CCC is the more actionable metric for working capital planning.
Which component has the biggest impact on CCC?
For product-based companies, DIO typically carries the most weight. For B2B service firms, DSO is the primary driver. J.P. Morgan's Working Capital Index 2024 identifies DIO as the largest single opportunity for U.S. nonfinancial assets, at $353 billion of a $707 billion total.
Are CCC benchmarks different for Canadian vs U.S. companies?
The formula and principles are identical in both markets. Practical differences in supplier payment norms, invoice terms, and Canadian regulatory requirements (such as CRA remittance schedules) can affect DPO and DSO management. Canadian SMBs also face more acute cash pressure: insufficient cash flow is a top challenge for 29% of surveyed businesses (Float Financial, 2024).